Generating Simulation Data
The code can generate simulation data by setting FlagRec to 0 in parameter file (see Parameter File).
The output simulation data files are sim_ptr.txt, sim_signal.txt, sim_source.txt, sim_phase.txt and sim_snr.txt in the subdirectory data/.
sim_ptr.txtis the simulated pulsar timing residuals, whose format is described in Data Format.sim_signal.txtis the corresponding noiseless pulsar timing residuals.sim_source.txtis model parameters of close binaries of supermassive black holes randomly generated. It contains eight columns, which represent right ascension (rad), sine of declination, cosine of inclination, polarization (rad), initial orbital phase (rad), logarithm of initial orbital angular frequency (rad per year) and logarithm of merging time (year).sim_phase.txtcontains pulsar phase parameters. It has \(N_{\rm s}\) rows and \(N_{\rm p}\) columns, where \(N_{\rm s}\) and \(N_{\rm p}\) are numbers of sources and pulsars respectively. The value in i-th row and j-th column is the pulsar phase of j-th pulsar to the i-th source.sim_snr.txtis the signal-to-noise ratio of each source.
Run
python plot_sim.py
in the analysis subdirectory will output figures residual_sim.pdf and skymap_sim.pdf.
residual_sim.pdfis the plot of simulated pulsar timing residuals of each pulsar.skymap_sim.pdfis the distribution of pulsars and sources on the celestial sphere.
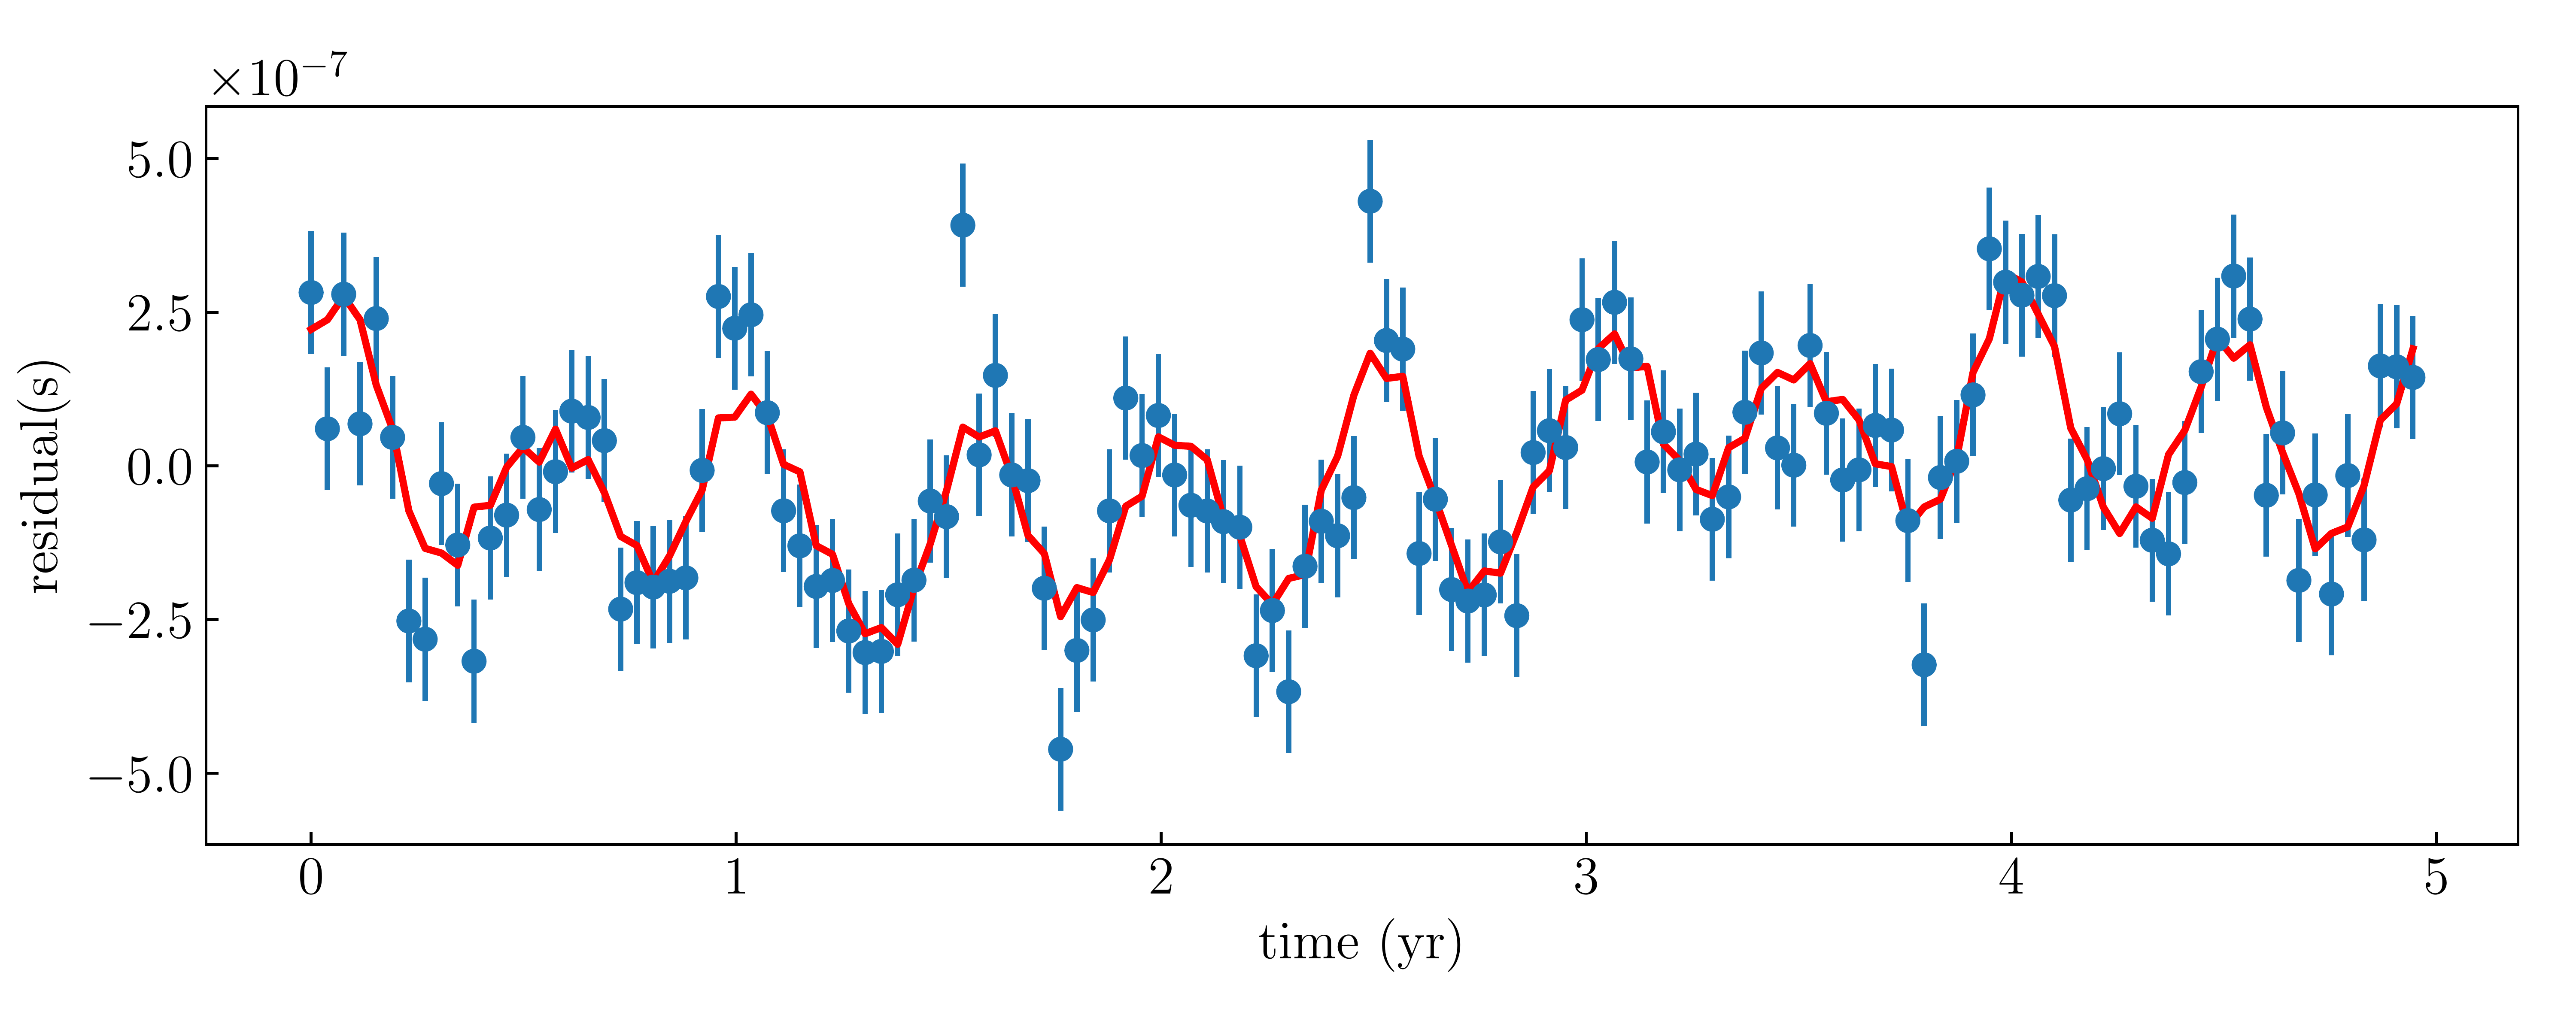
Example for simulated timing residuals of a pulsar. The red line is the noiseless signal.
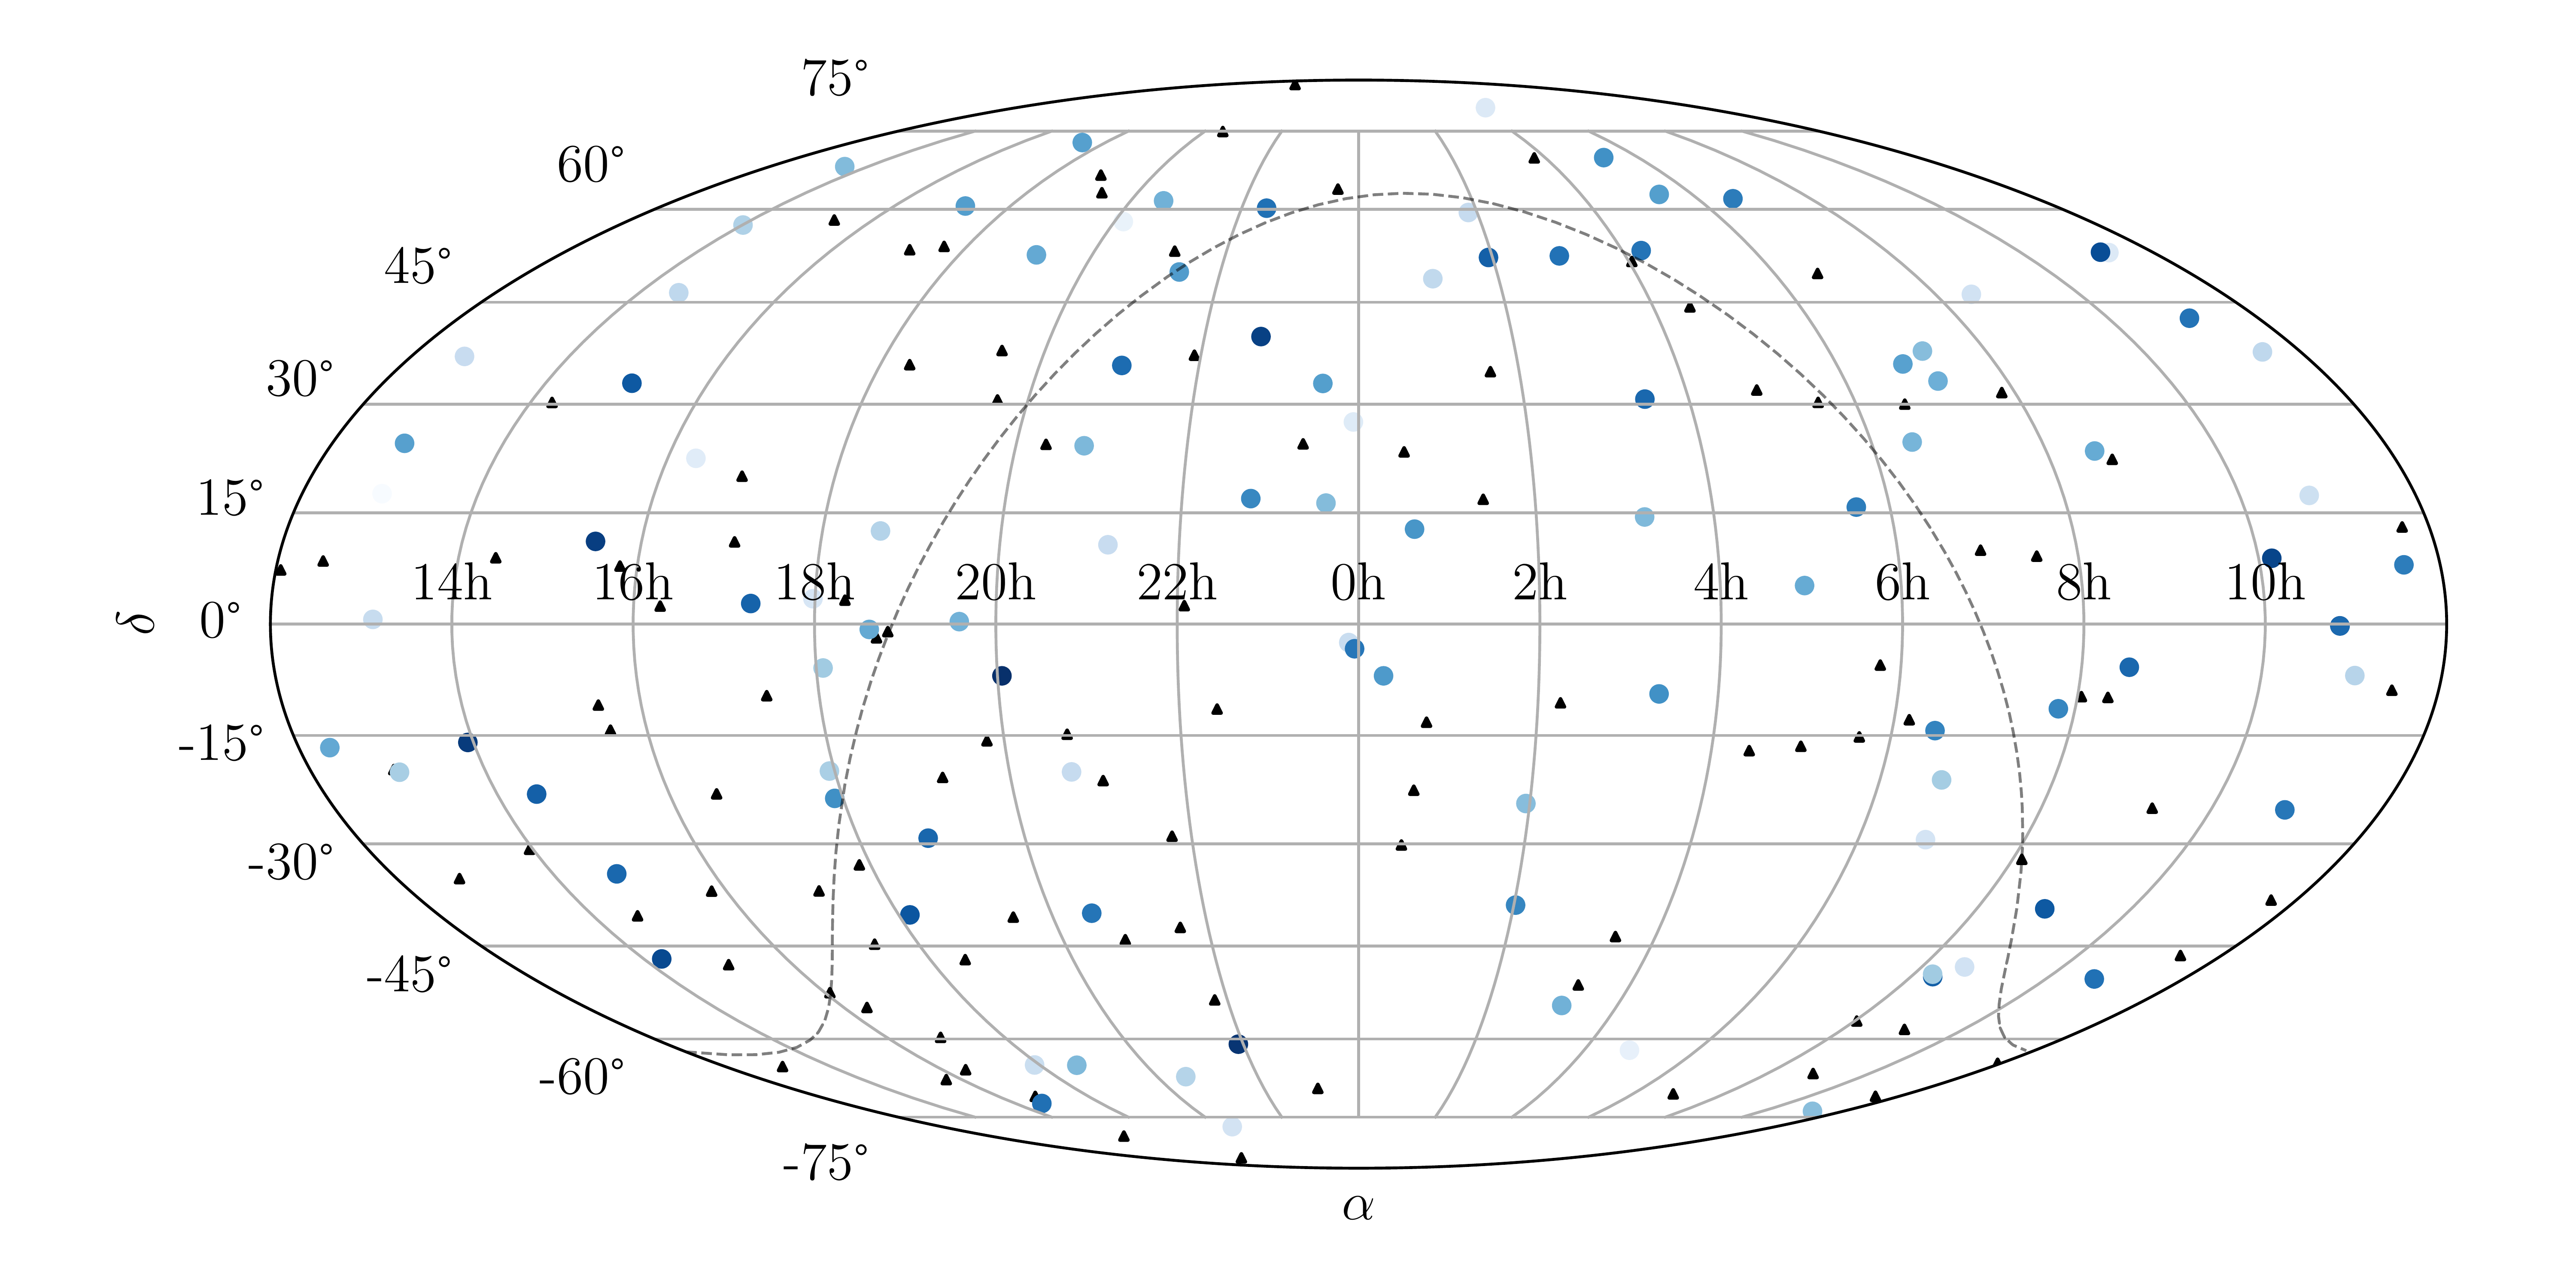
Example for distribution of simulated pulsars and sources on the celestial sphere. The blue points and black triangles are sources and pulsars respectively. The depth of the blue color indicates the SNR of the source.